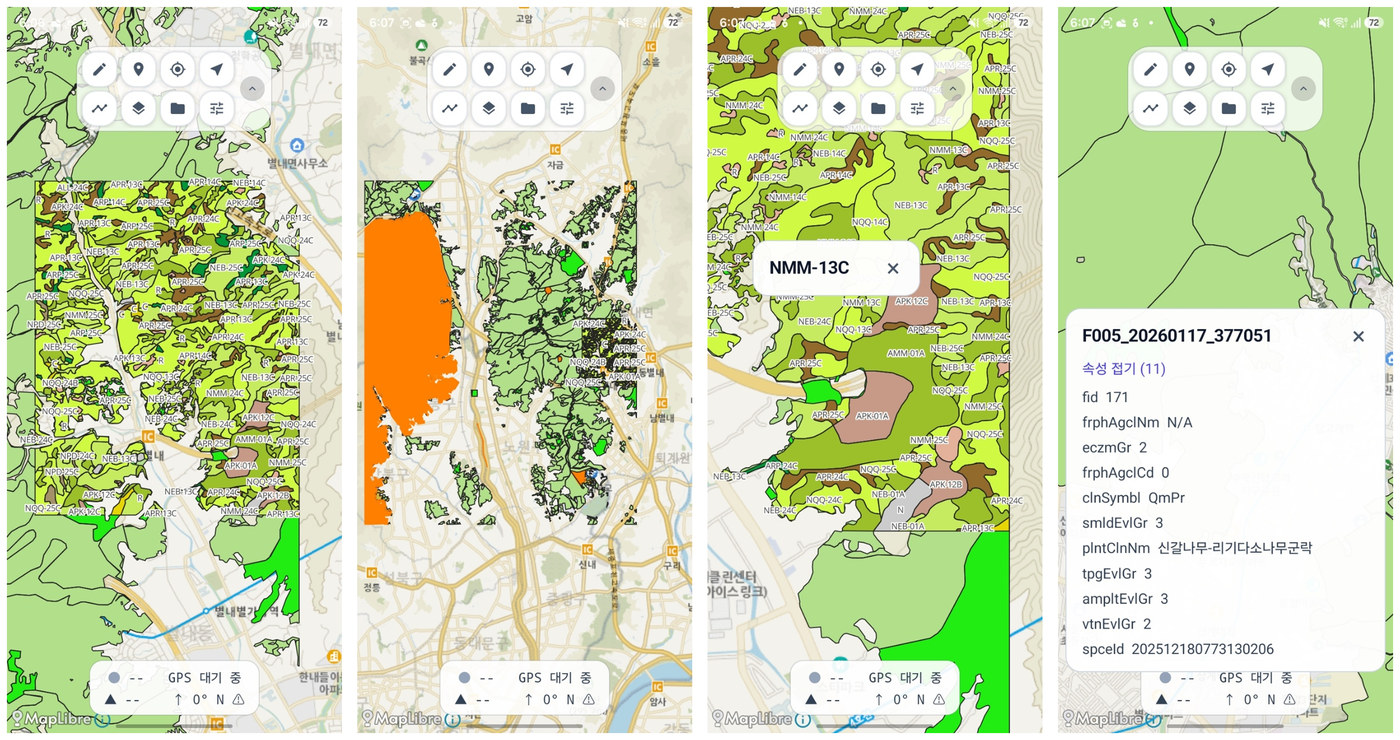

Note: the screenshots in this manual were captured with the app in Korean. The app itself
switches to English under Settings → Language; each caption explains what the screen shows.
1. Why GeoTrace
- The free and open-source mobile GIS and GPS apps available today run into limits during real field survey work.
- GeoTrace keeps the philosophy of traditional GIS modules — creating lines, polygons, points and tracks as GIS objects.
- It adds what those tools lack: the many kinds of handwritten notes that are awkward to express as GIS objects in the field are returned as GIS objects, ready to use for reference in QGIS.
2. Platform
- Android only for now. iOS devices are not yet available for testing; an iPad and iPhone build will be tested and released once hardware can be sourced.
- To get the most out of the app on a phone or tablet you need a stylus — a Galaxy S Pen or the stylus supplied with your tablet.
- Without a pen you can still sketch and take notes with your finger.
3. Base maps
- The developer is Korean, so the default base map is VWorld — the online base map most widely used in Korea. Google satellite imagery is also available for users outside Korea.
- Users outside Korea can add the WMS or XYZ tile services used in their own country by writing an XML file and importing it as a base map.
3.1. Adding a base map
- Create an
.xmlfile in the format shown below. - Copy the file to your device (for example, the Download folder).
- In the app, open the base map menu → Import from XML and pick the file.
- Imported maps are saved and stay in the list the next time you launch the app.
XML example
<?xml version="1.0" encoding="UTF-8"?>
<mapSources>
    <source
      name="MAP NAME"
      url="https://example.com/tiles/{z}/{x}/{y}.png"
      minZoom="0"
      maxZoom="19"
      servers="" />
</mapSources>| Attribute | Default | Description |
|---|---|---|
name |
required | Name shown in the menu |
url |
required | {z}/{x}/{y} tile address |
minZoom/maxZoom |
0/19 | Zoom range at which the map is drawn |
servers |
none | Server list substituted into {s} (for example a,b,c) |
type |
xyz | xyz or wms |
role |
base | base (base map) or overlay (layer drawn on top) |
- Extra attributes for WMS —
layers(required),version(1.3.0),crs,format(image/png),transparent(true),opacity(0.7),attribution, andauthType·key·domainwhen authentication is required.
A ready-made set of worldwide sources is included in this repository — download it and import it with Import from XML:
Download world map sources (XML)3.2. Things to watch for
- Replace any
&in a URL with&. - An entry with an empty
nameorurlis not registered. Give every map a distinct name. - Even if you list several values in
servers, only the first one is actually used. - To use a WMS as a base map its CRS must be EPSG:3857. Any other CRS can only be drawn as an overlay.
- Check the tile provider's terms of service before you use a source.
4. Main menu
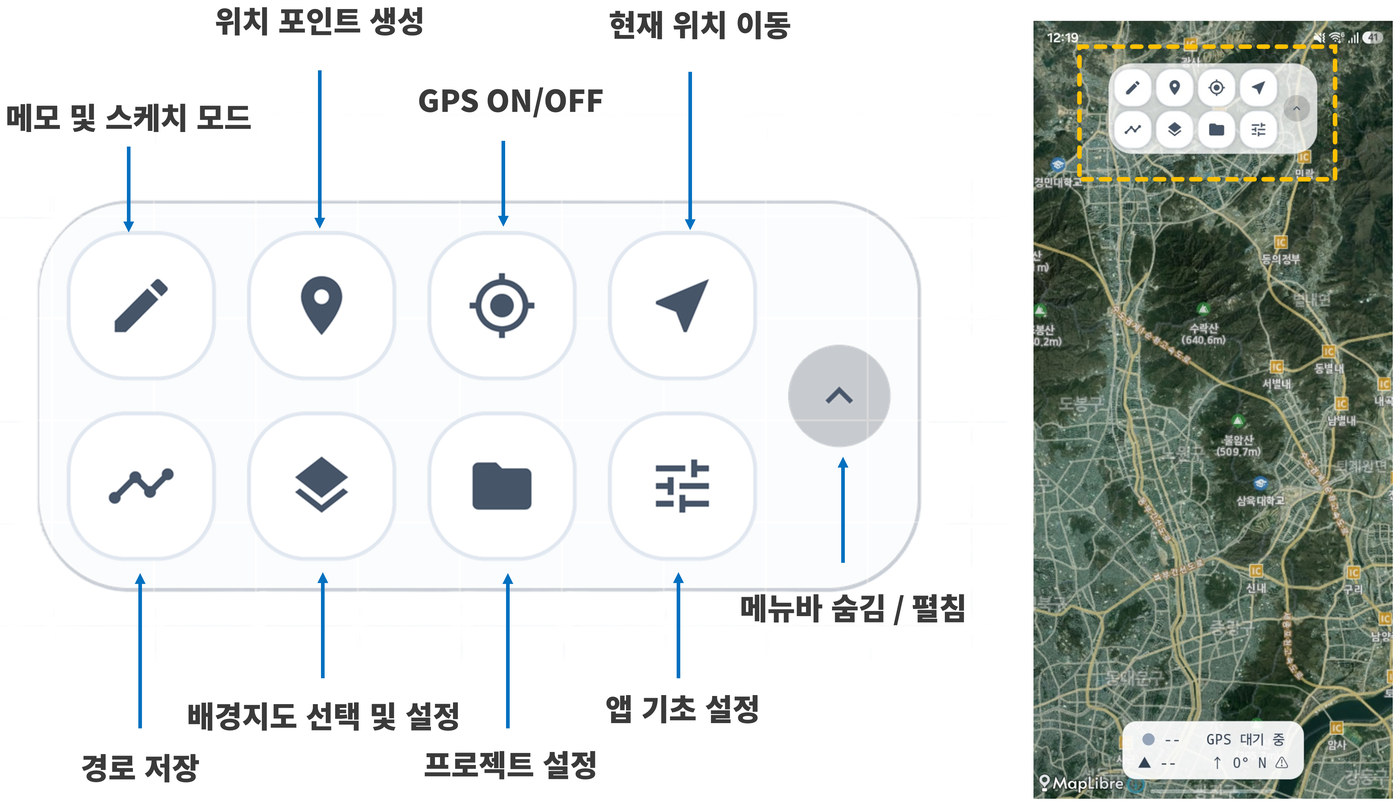
5. Sketch mode (handwriting and drawing)
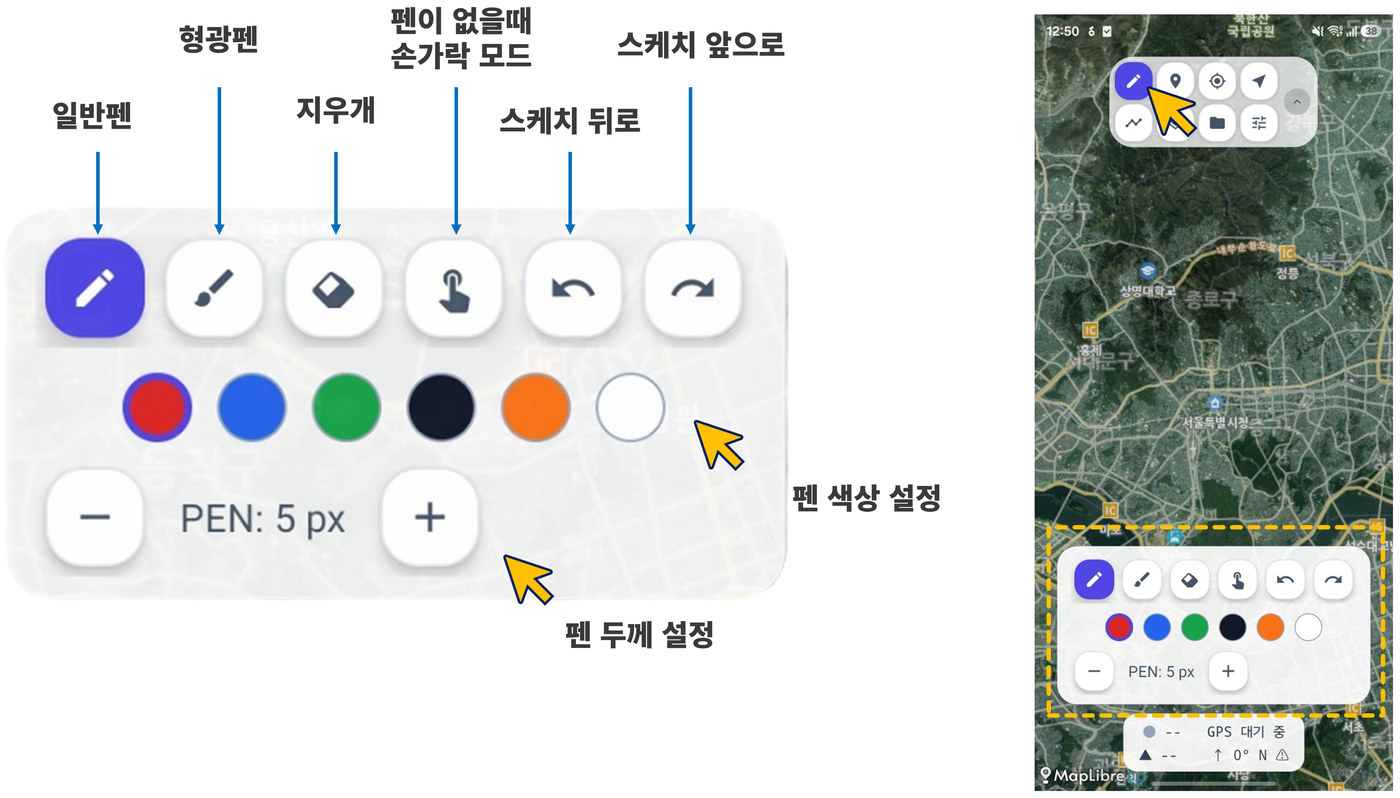
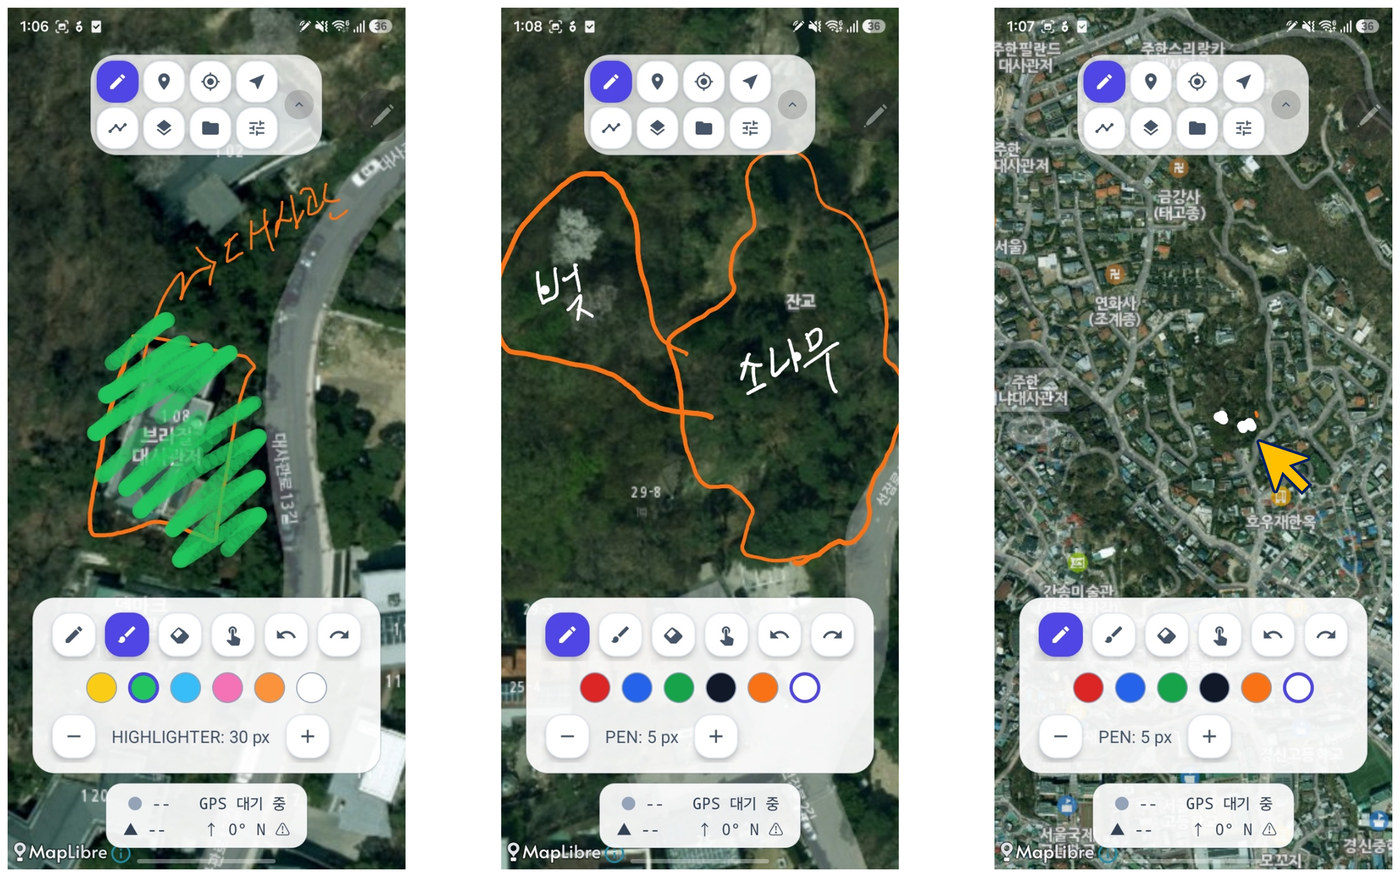
- Write and draw directly on the map with a pen paired to your phone or tablet.
- Everything you draw is stored as a vector object, ready to use in QGIS.
- Sketch objects carry a marker that helps you find them as you zoom in and out. The marker is only a screen aid — it is not written to the exported GPKG.
6. Adding survey points
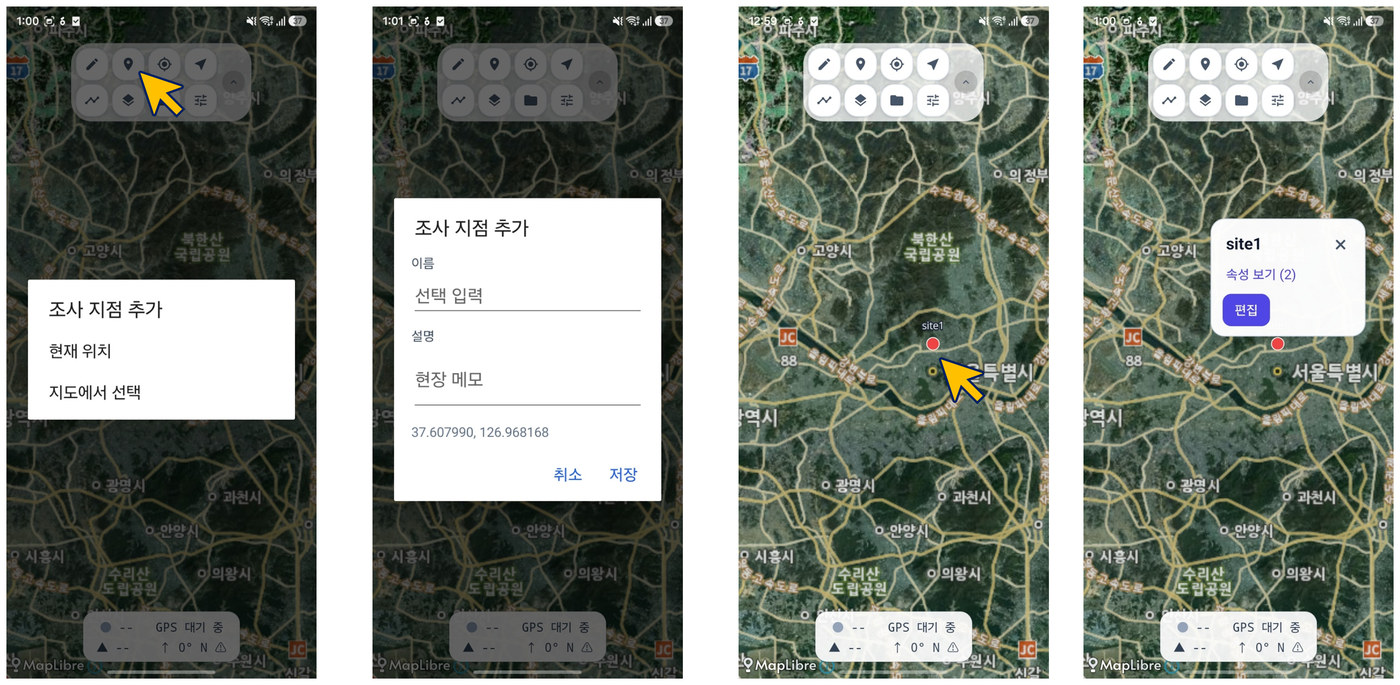
- With GPS on, drop a point at your current location.
- Or tap the map to place a point wherever you choose.
- Each point is labelled with its name attribute. Tap a point to view and edit its attributes.
7. Recording tracks and the GPS panel
- Track line colour and thickness are configurable under Settings.
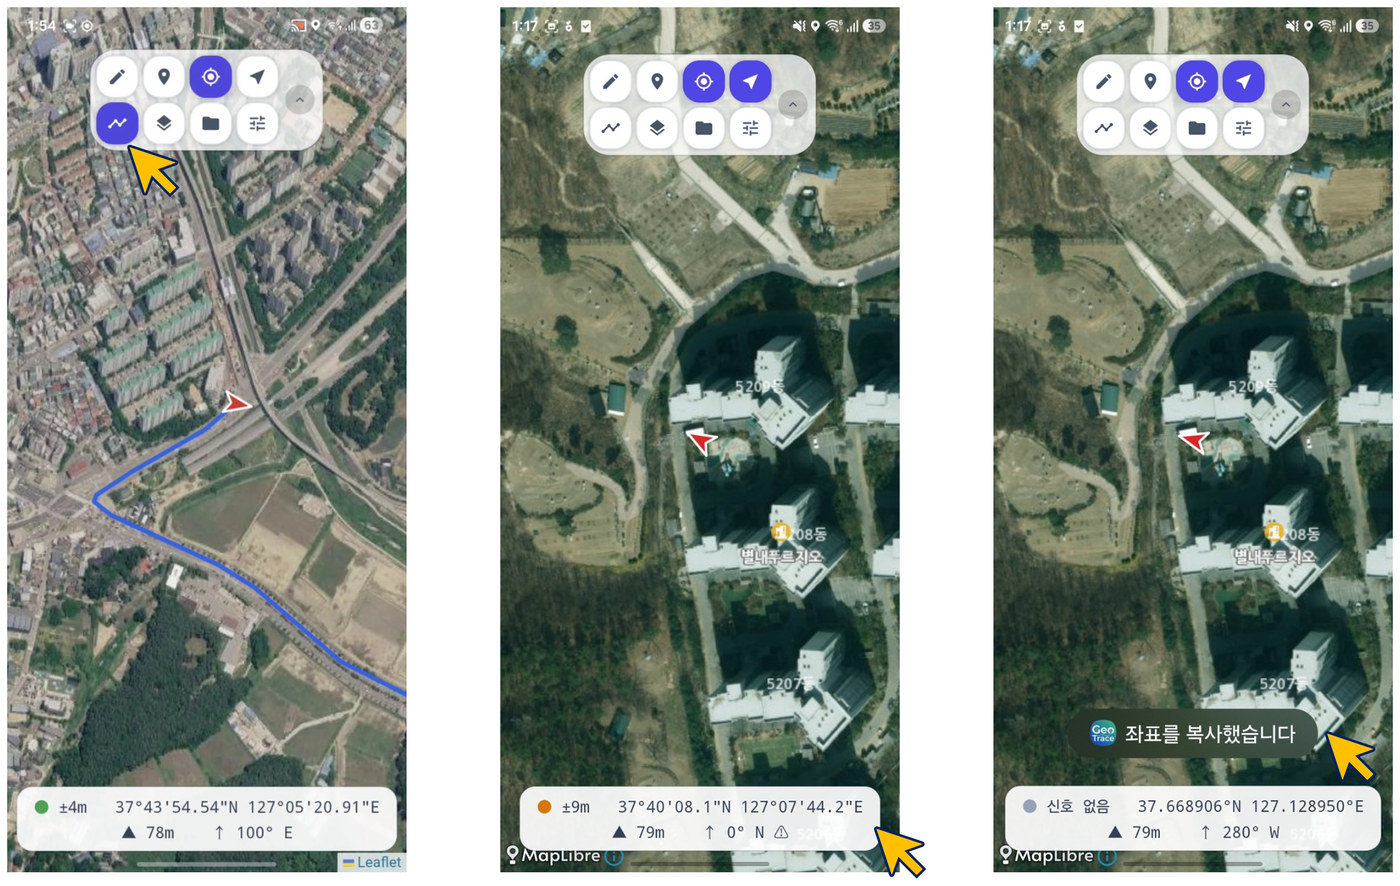
- The GPS panel shows signal strength, the coordinates of your current position (latitude and longitude), altitude, direction of travel, and the device heading on a 16-point compass (N, NW, S and so on).
- Coordinates can be shown as decimal degrees or DMS. Set this under Settings, or tap the panel to switch format on the spot.
- Press and hold the GPS panel to copy the current coordinates to the clipboard.
8. Base map settings and overlay maps
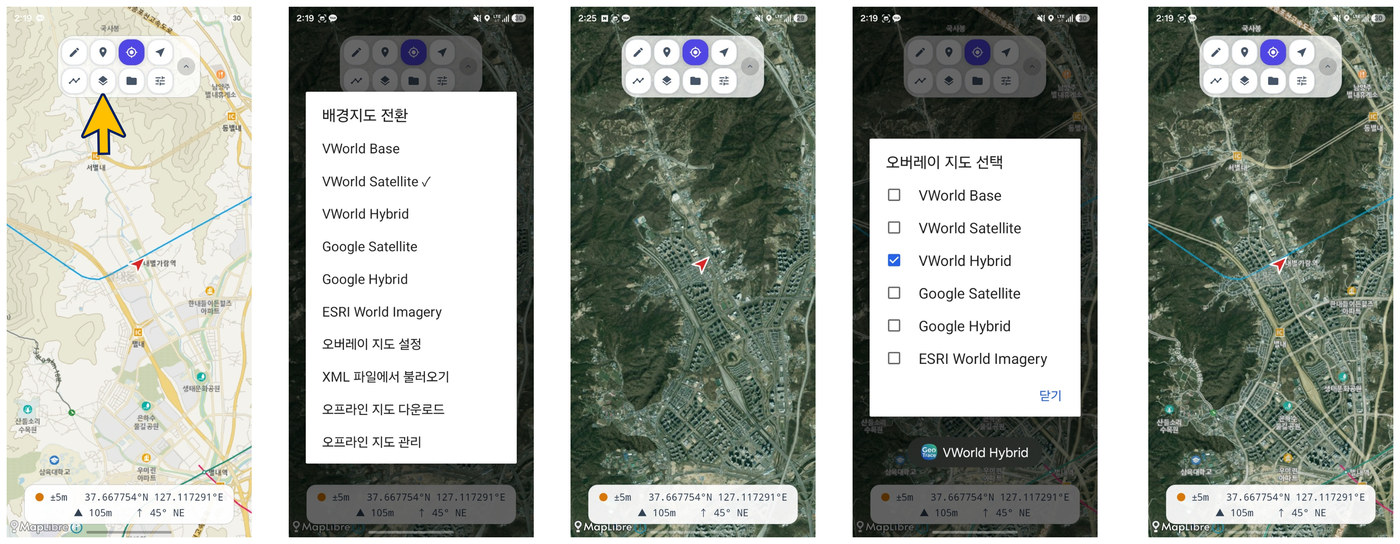
- The app is built around Korea, so the VWorld base map is shown by default.
- An overlay map draws a vector map on top of imagery. In Korea, for example, you can put VWorld Hybrid over VWorld Satellite to show place names, roads and other vector information on top of the imagery.
9. Saving maps for offline use
- For areas with no mobile data, download the map of the area you plan to survey while you still have a connection, then use it offline.
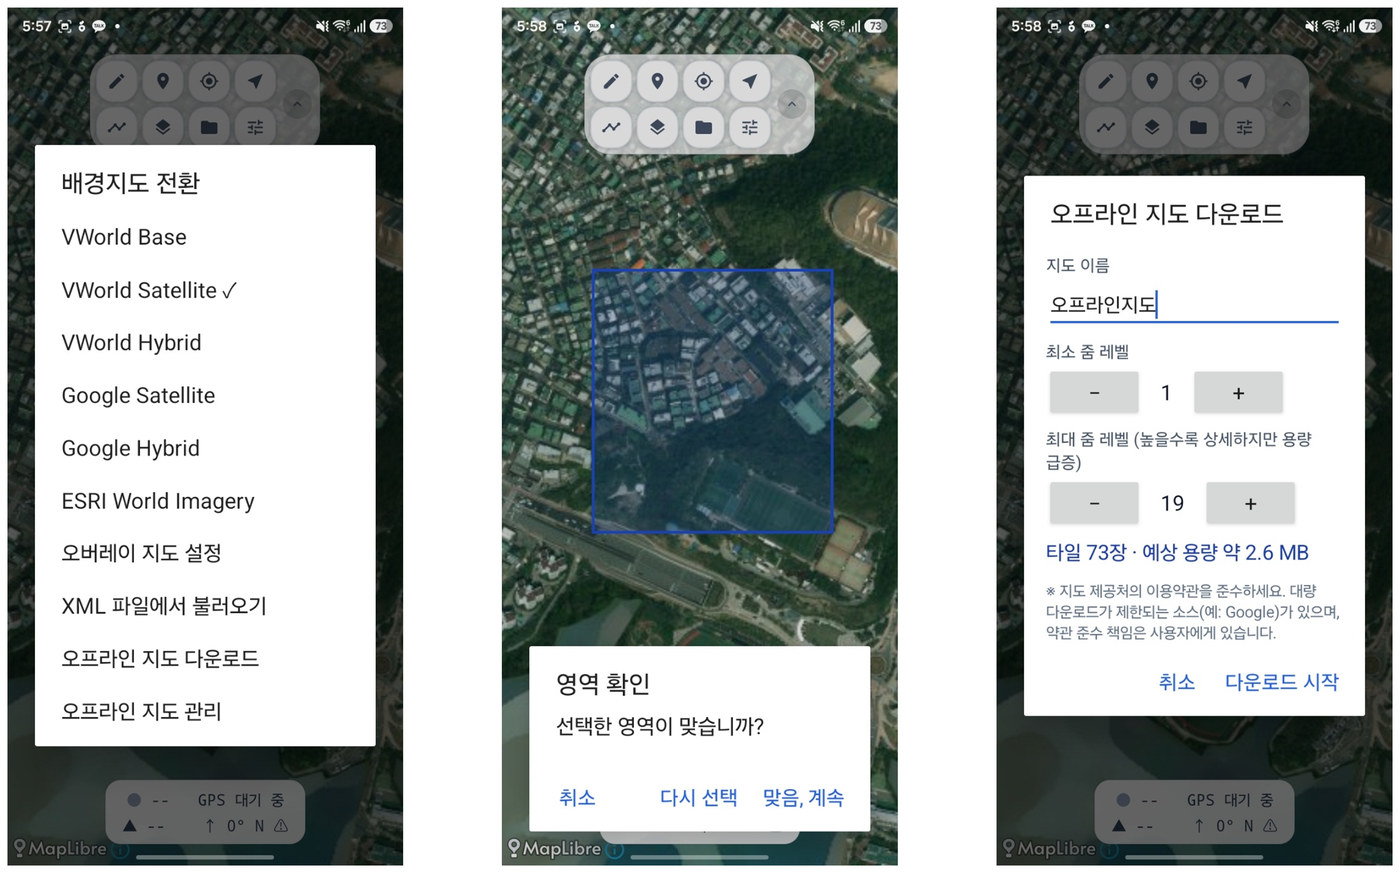
Follow each provider's terms of service. Some sources — Google among them — restrict bulk
downloading, and compliance is the user's responsibility.
10. Project management
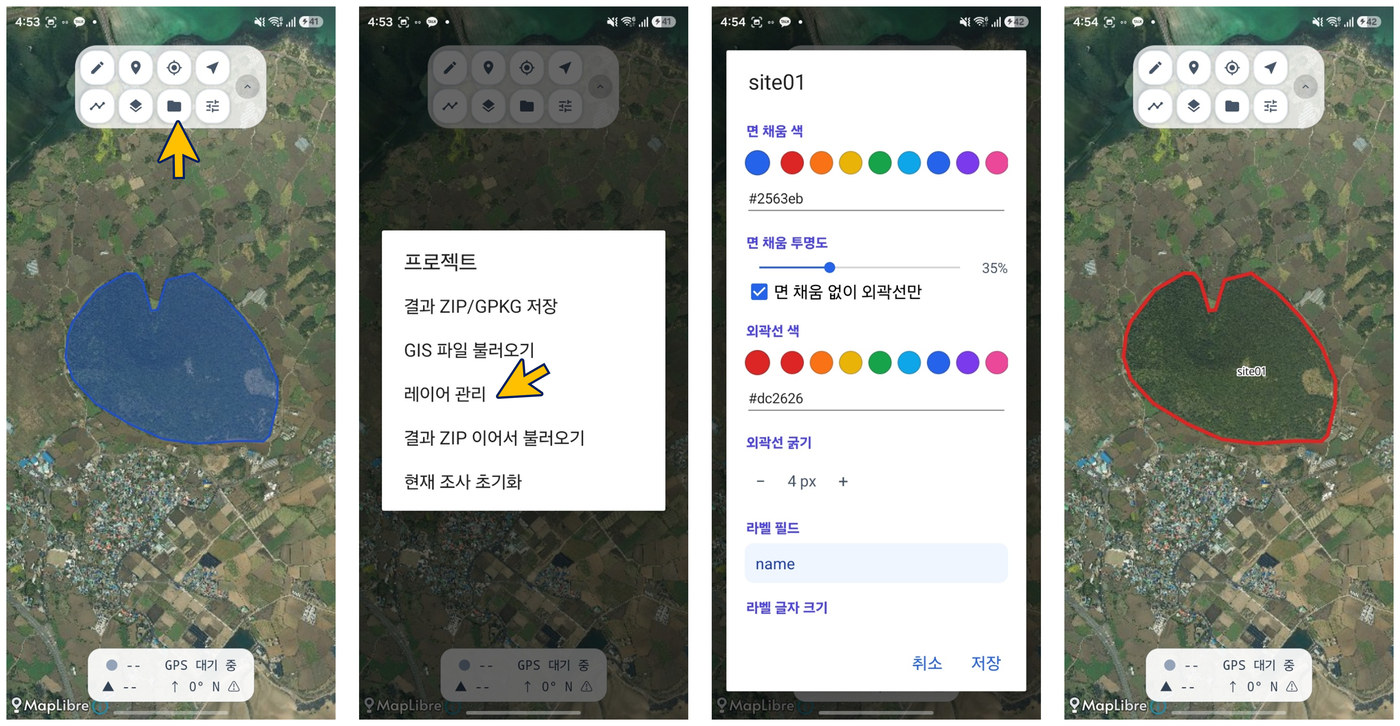
- Project management covers importing the GIS data you want to overlay on the map, managing layer symbology, and resetting the current survey.
10.1. Importing GIS files
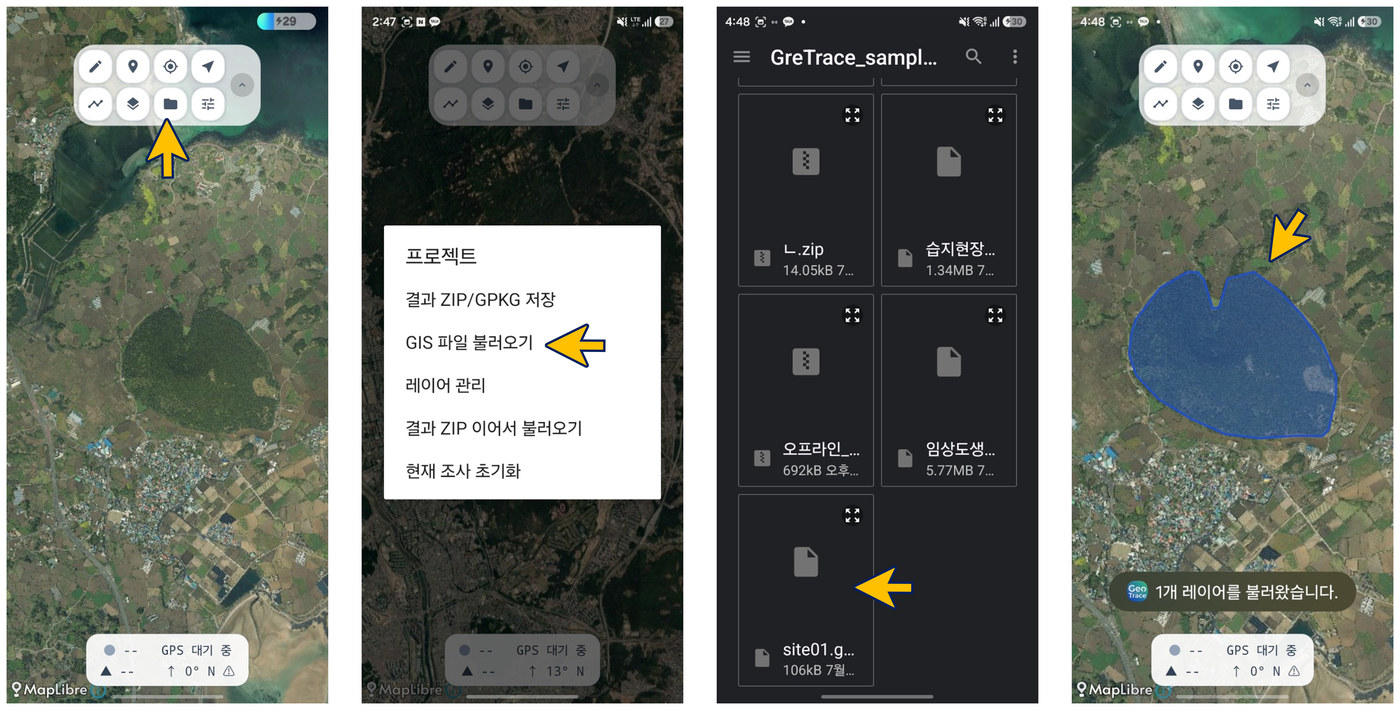
- Import data you prepared beforehand in a desktop GIS.
- Supported formats are GPKG, KML and KMZ. GeoTIFF support is planned.
- Imported files are drawn with the default symbology shown below.
10.2. Managing layers
- Layer management controls the symbology of the GIS data you imported.
- Set fill colour, polygon opacity and labels.
10.3. Exporting results as ZIP/GPKG
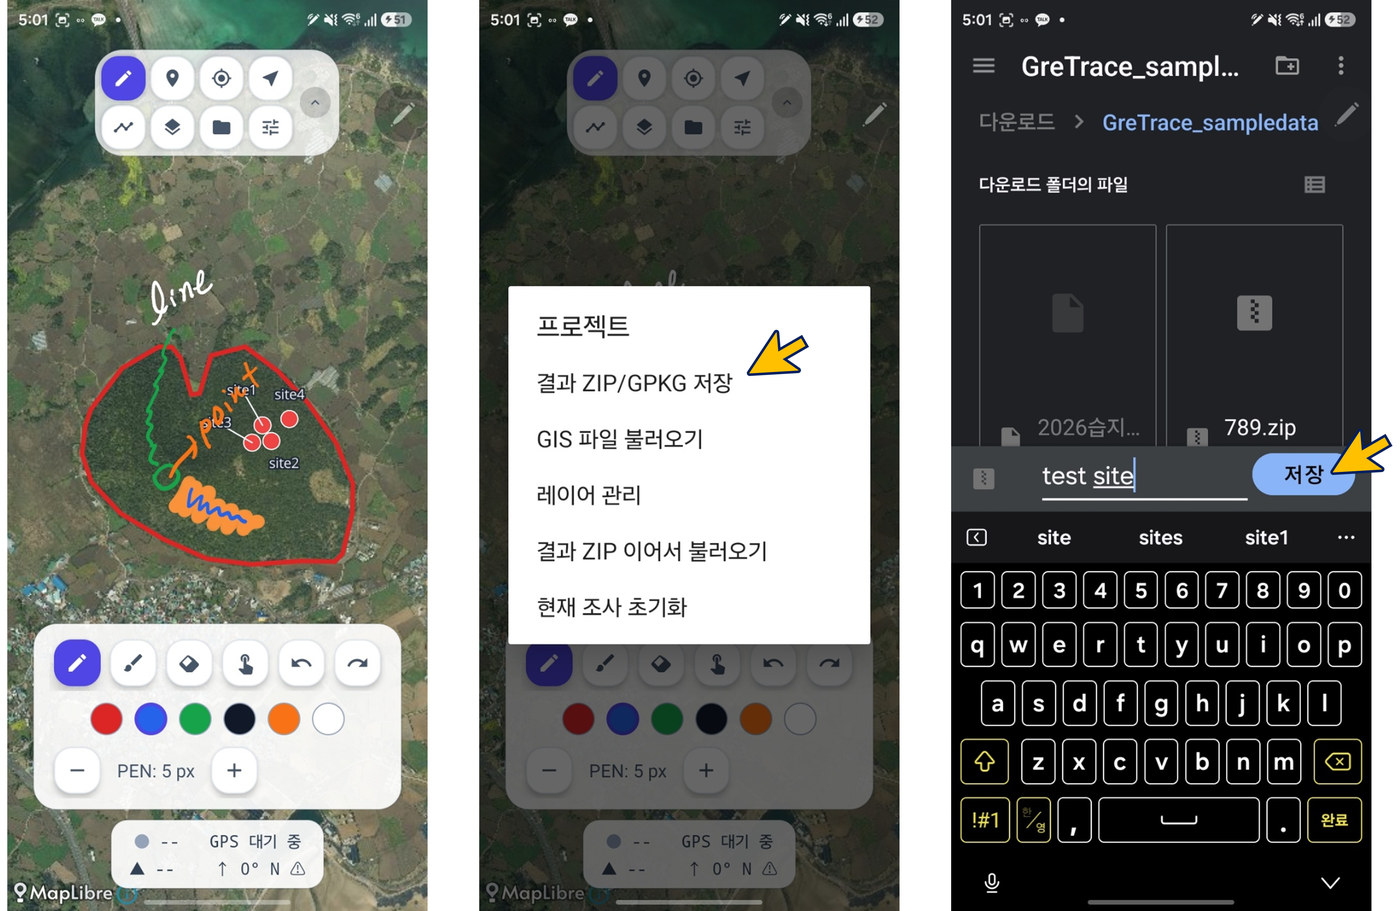
- Export the tracks, points and handwritten notes you recorded in the field as a single ZIP file.
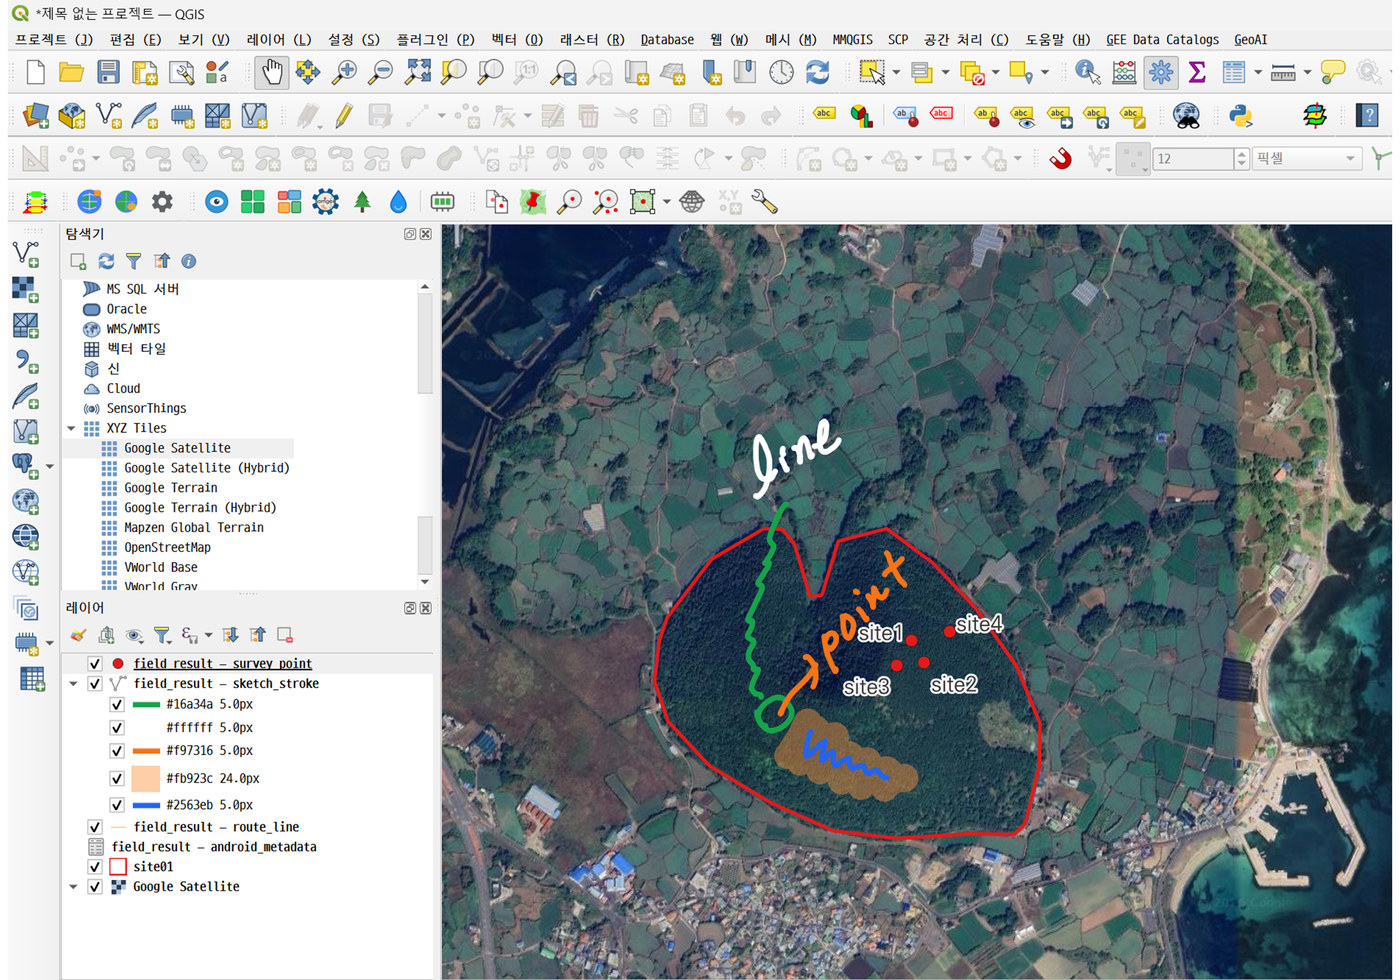
- Unzip it and inspect the contents in QGIS or any other GIS.
- Inside the ZIP,
field_result.gpkgholds all of the data — points, sketches and tracks.
11. Settings
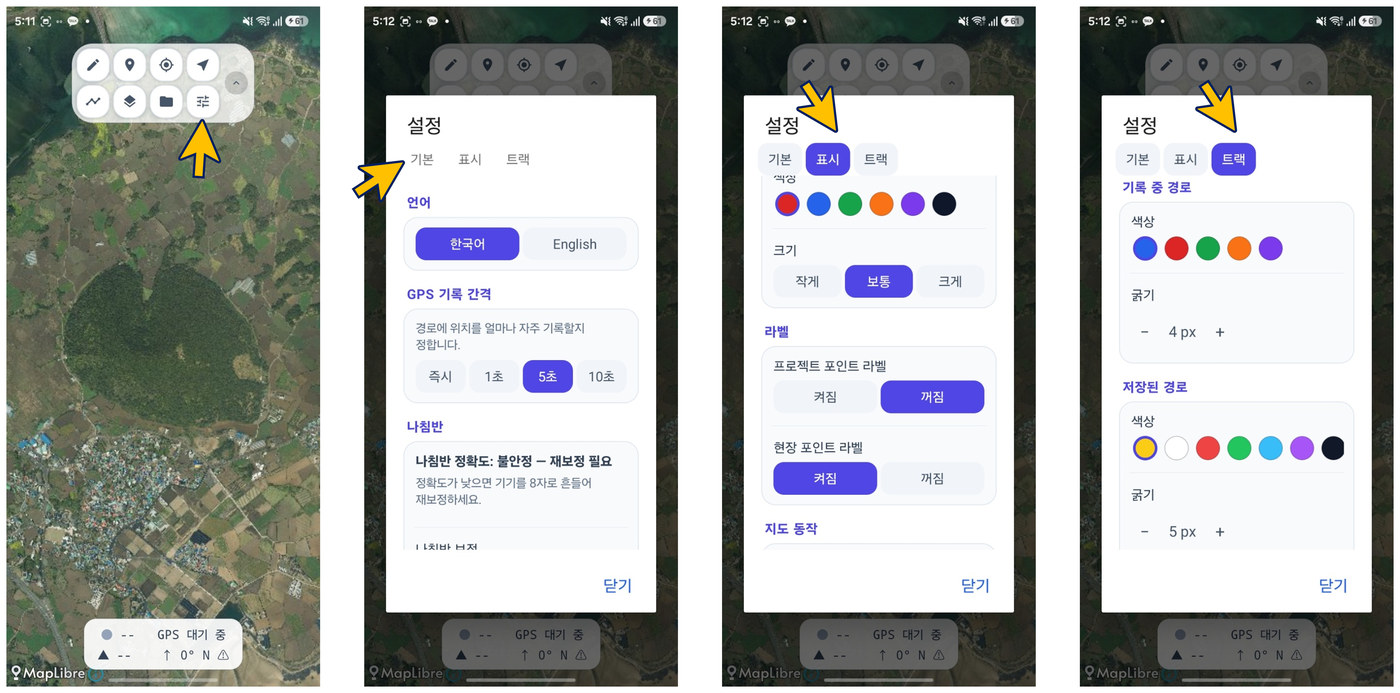
- Settings are grouped into three sections: General, Display and Track.
- General holds the language setting and the GPS recording interval — how often a position is recorded while a track is being saved (1, 5 or 10 seconds).
- The compass setting corrects the GPS panel's bearing when the device sensor is off.
- Display covers the saved track, point labels and colours.
- Track adjusts how routes are drawn — the colour of the track being recorded and the colour of imported tracks.
12. Other features
12.1. Hiding the menu and landscape mode
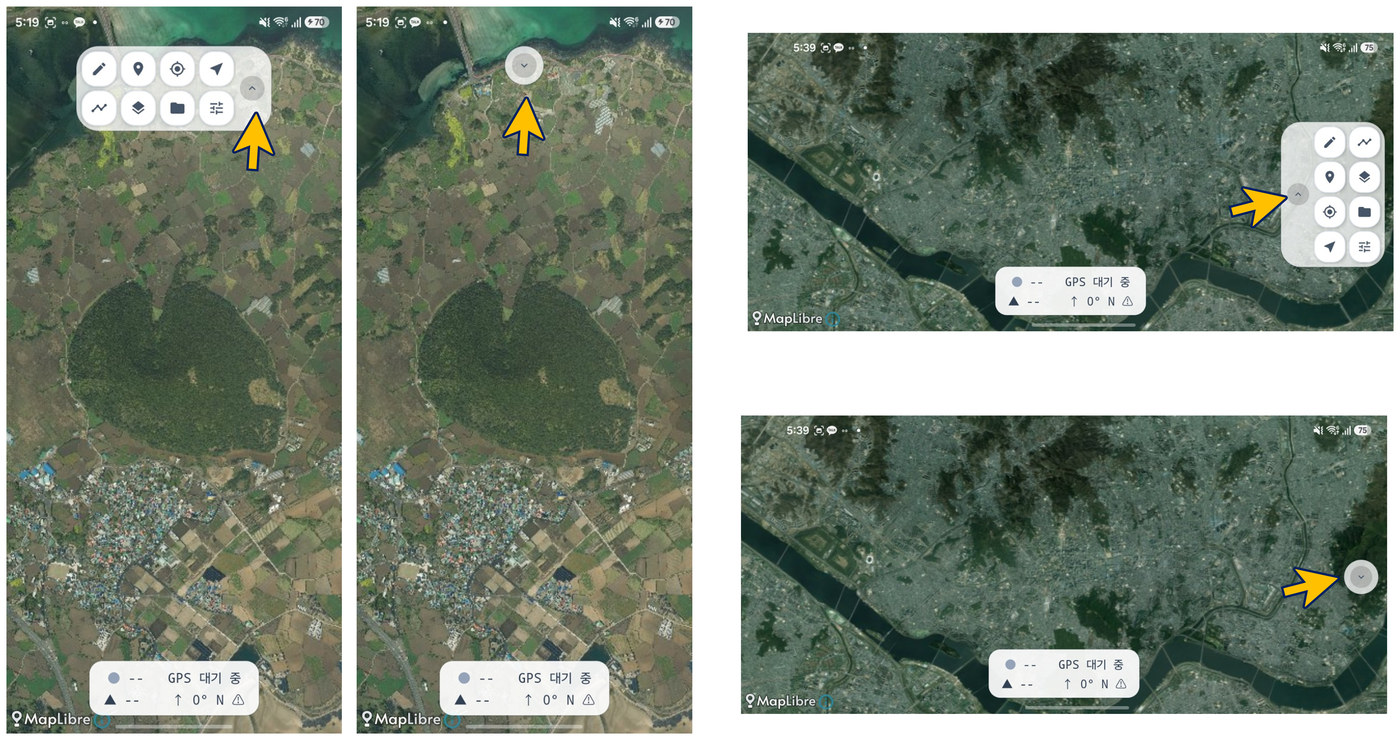
- The main menu at the top of the screen can be collapsed with the hide button. In landscape mode the menu moves to the right-hand side of the display, where it can also be collapsed.
12.2. Coordinate and address lookup
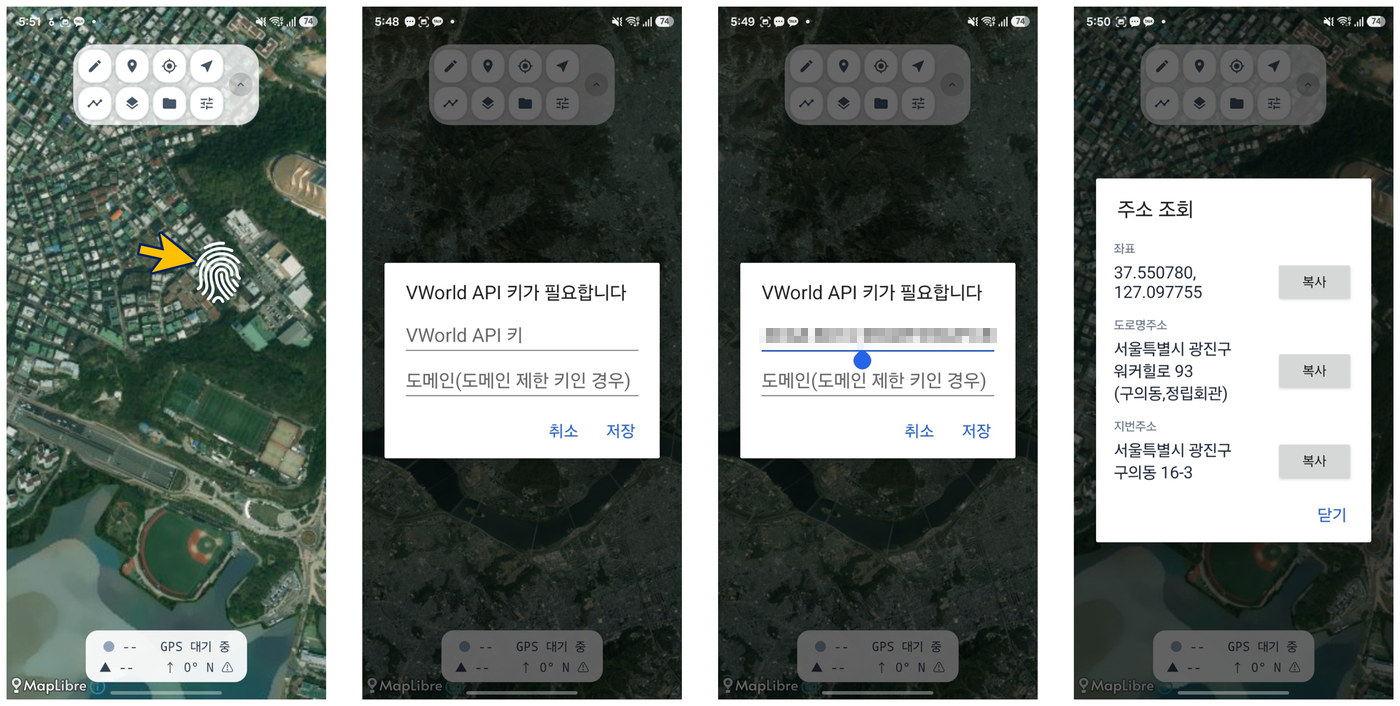
- Press and hold anywhere on the map to show the latitude and longitude of that point, along with its street address (Korean users only).
- Address lookup requires a VWorld API key, which you enter once on first use.
To obtain a VWorld API key:
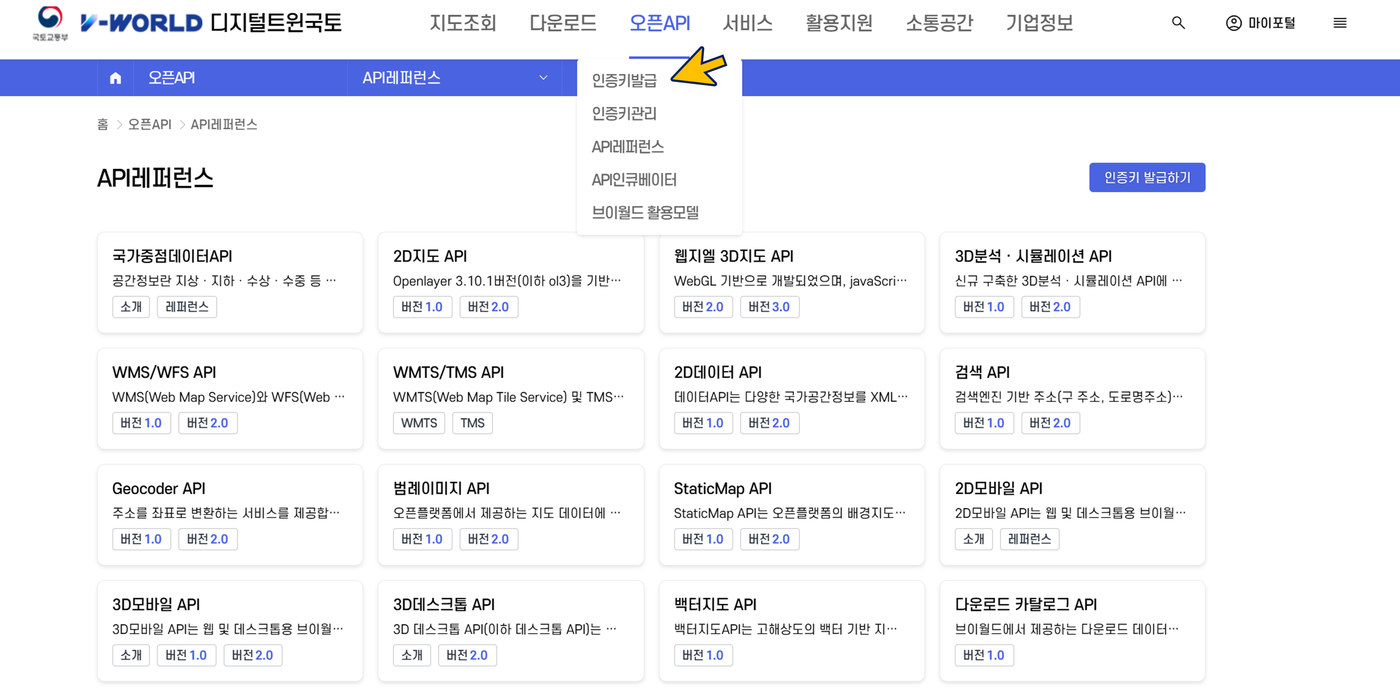
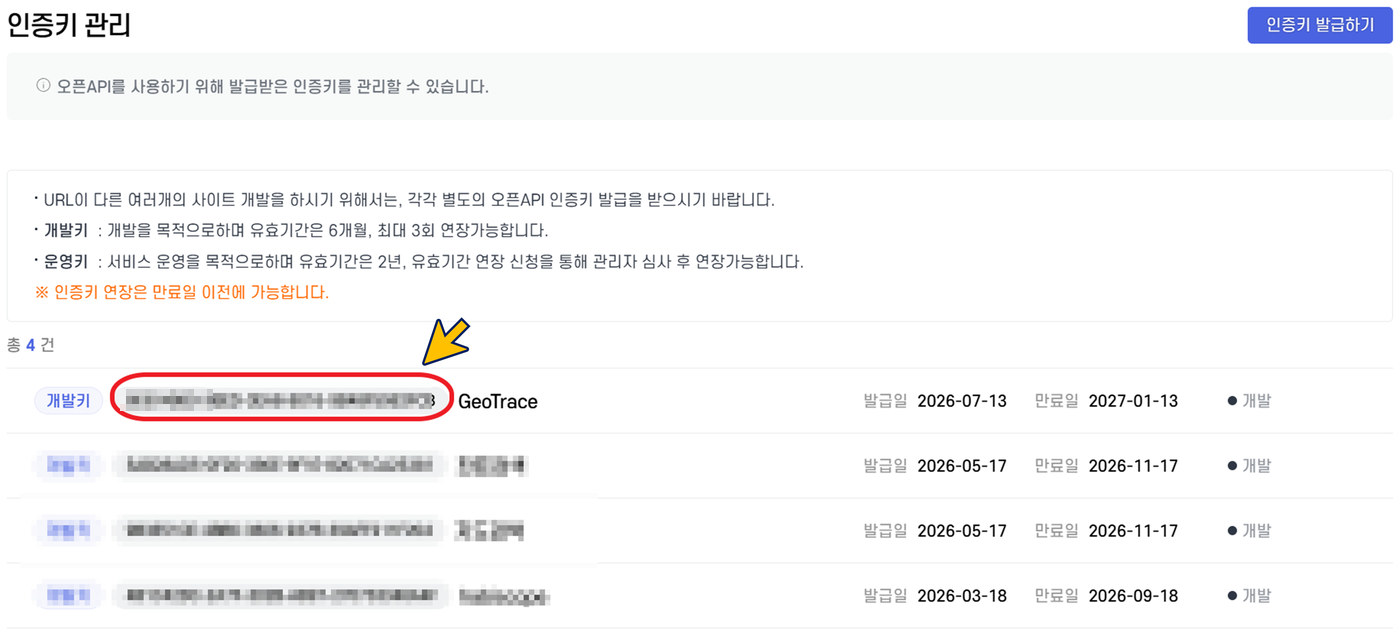
- Go to VWorld Digital Twin Korea → Open API → Issue authentication key.
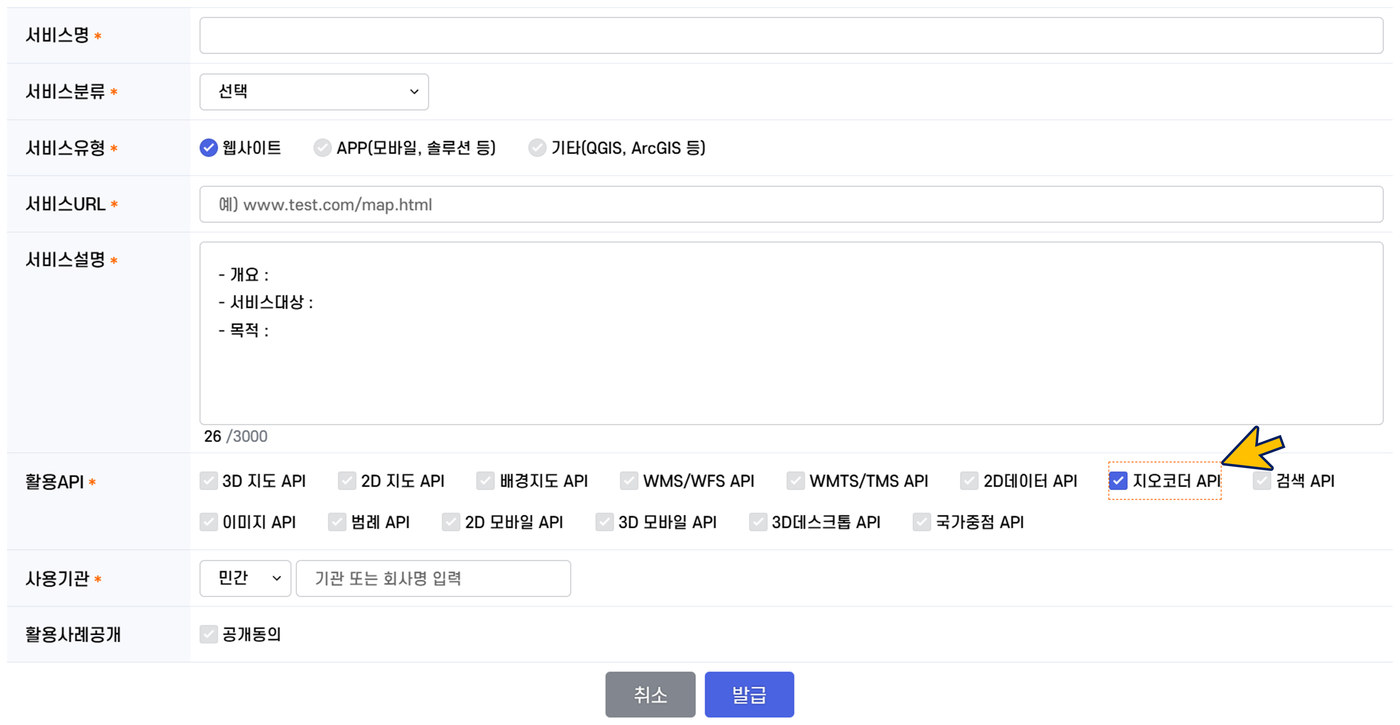
- Fill in the service name, service type and service URL, tick Geocoder API under the APIs to use, and submit the request.
- Open the key management page, copy the issued key, and enter it in the app.
12.3. Editing GPKG symbology and using Package Layers
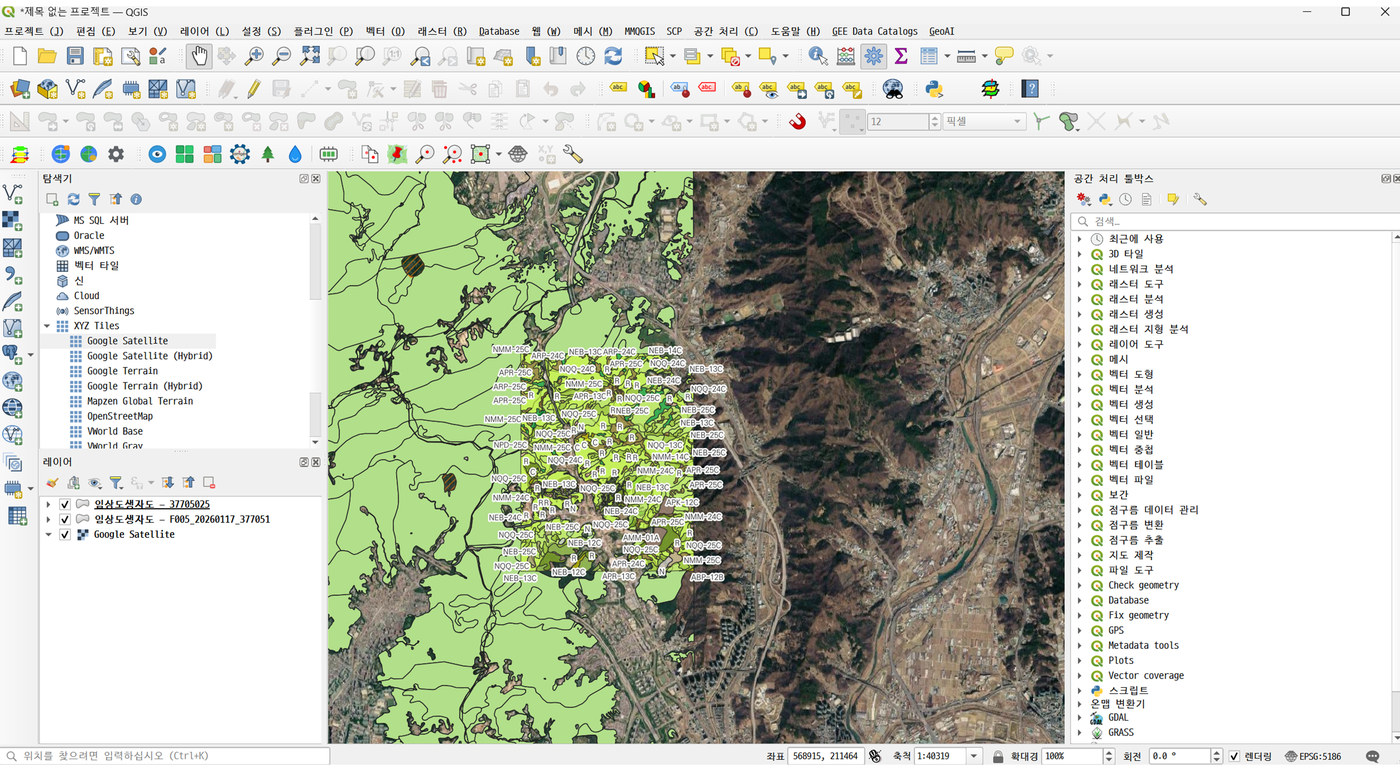
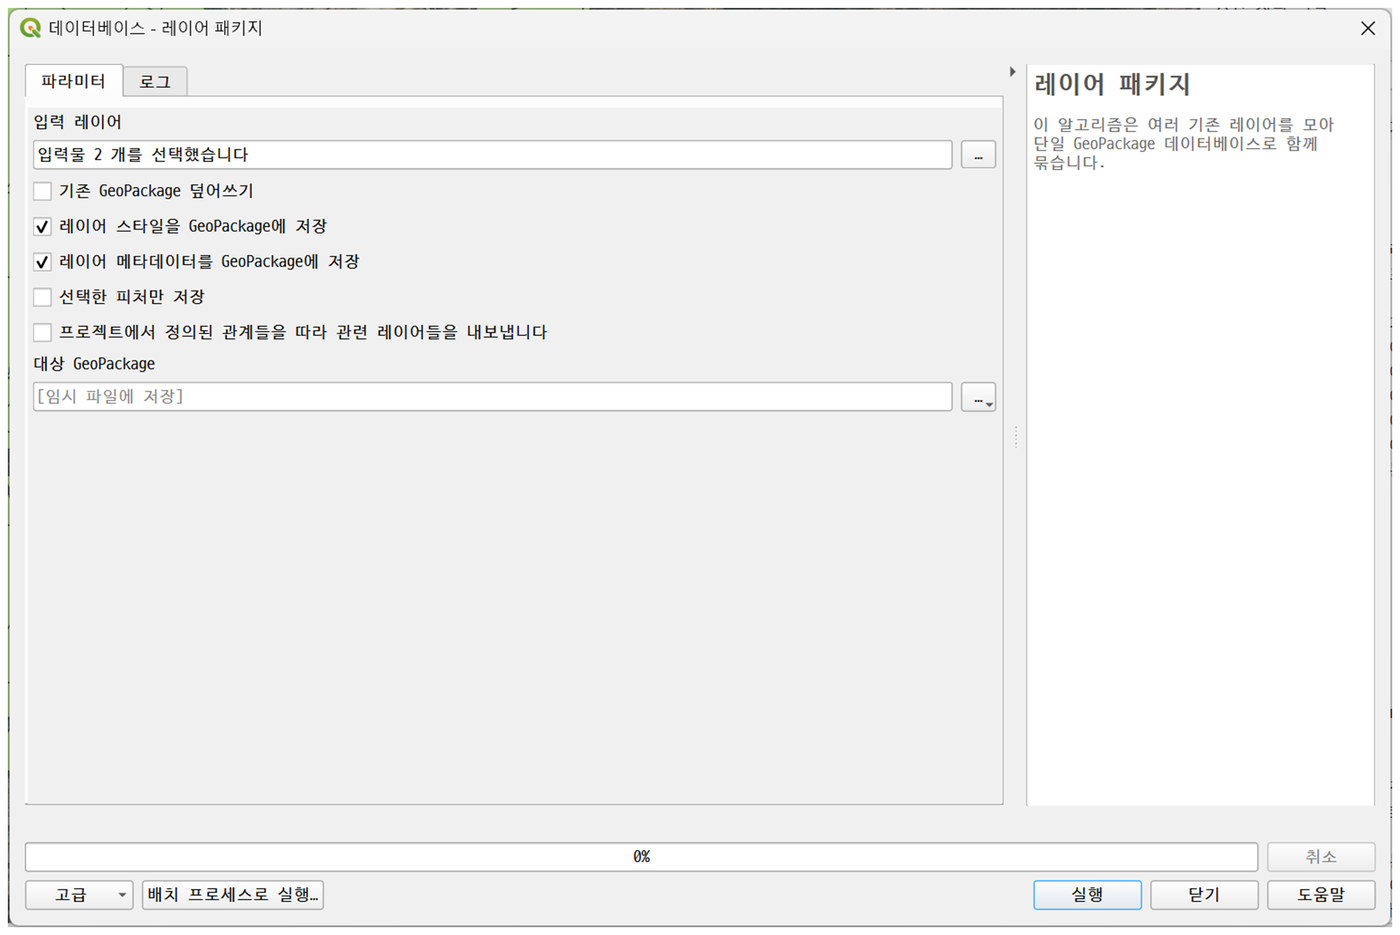
- Style the GIS data you use in the field in QGIS, then combine two or more layers into a single GPKG with the Package Layers tool and import that into the app.
- The polygon colours and labels you set in QGIS are carried through and drawn the same way in the app.